Lesson learned: use sentiment but keep your eyes on other variables to understand what is happening in the stock and watch for non-confirming price action.
A major trend in leveraging Big Data for investing is to focus on NLP polarity analysis of electronic communication, more specifically social media like twitter (cashtags). The idea is straightforward – score tweets, posts, blogs, news, and/or other communication for positive and negative sentiment. A significant spike in positive sentiment is a buy signal, whereas a spike in negative sentiment is a sell signal. Such signals receive further reinforcement when accompanied by spikes in volume of mentions.
For extremely short-term trading lasting from a few seconds to a few days, such an approach can make sense. An assumption of course is that you are able to take advantage of such shifts in sentiment quick enough. For traders and investors looking at slightly longer term holding periods, the sentiment indicator becomes yet another variable that should be incorporated into a more holistic analysis which includes looking at price action or the movement of the traded stock price.
As an example, we can look at what happens near the end of bear markets. They do not end on the day that horrific news is replaced by glowingly positive news. Generally they end when prices stop falling on negative news and even move higher in the face of continued negative news (albeit slightly less negative news on the margin, which is the topic for a different post). At such a stage, the markets implicitly state that they have already incorporated contingencies for such negative news and that they likely overshot a bit in terms of valuation. The actual positive news begins well after the actual market low. In other words, if you were trading on simple binary NLP polarity sentiment under these conditions you would not have done very well by waiting for news to become positive. In this case, the key would have been to follow sentiment and price action and look for divergences which imply an important change in market direction.
The same thing occurs in specific stocks. Many times stocks will hit a particular level and resist flashes of sentiment spikes. In other words, you could have a directional movement due to the sentiment shift but the price would return rapidly or even begin to move in the opposite direction. Astute investors realize that when stock prices become resistant there is something else going on that requires a closer look.
The point is that beyond very short-term trading scenarios, sentiment variables should be taken in context with other variables such as stock price action and with the stage of the stock in general.
The case of EBAY is very interesting in that it shows how a negative sentiment spike helped the stock breakout of a yearlong consolidation. This is somewhat counterintuitive as you would expect a large negative sentiment spike to result in a significant and sustained decline – in EBAY’s case, the opposite occurred in that it ended up breaking out of (going up through) a range that had trapped it for quite a while.
We will look at a number of images and take into consideration, stock price patterns, spikes in mentions and sentiment, short selling volume, and an eventual breakout. This study basically consolidates traditional technical analysis of stock trends, sentiment analysis, and short selling analysis – thereby marrying popular technical price trend analysis with sentiment analysis.
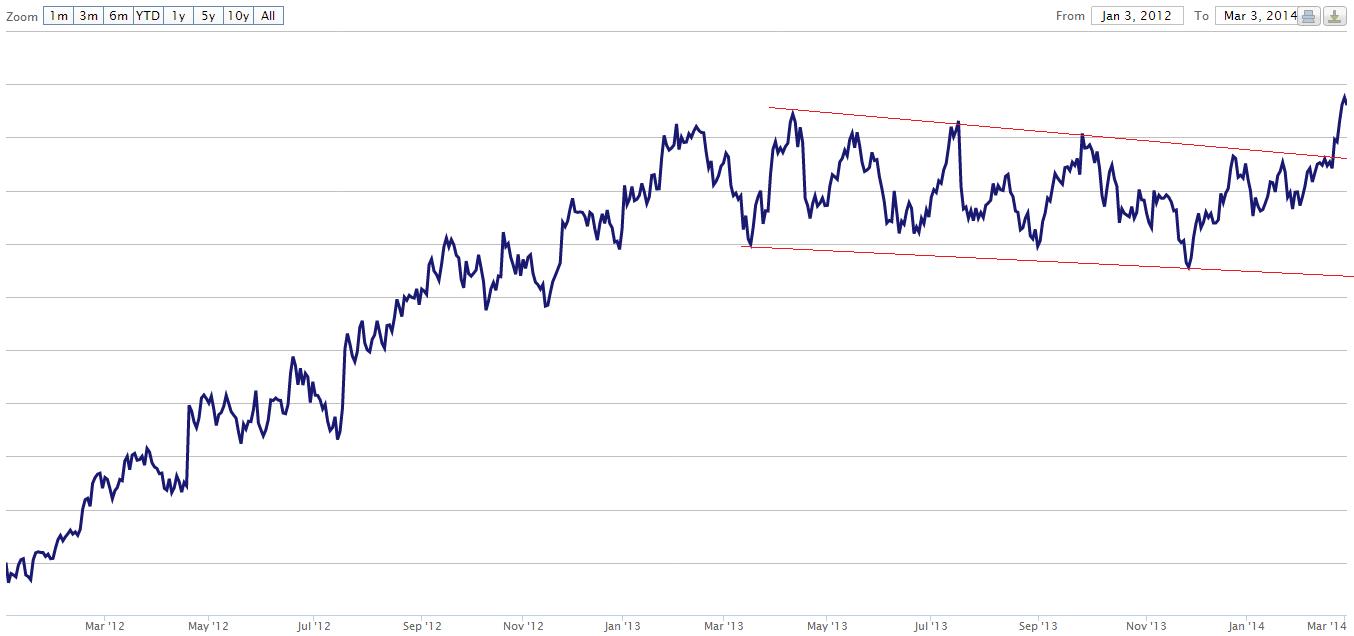
First, let’s start by looking at the stock chart for EBAY.
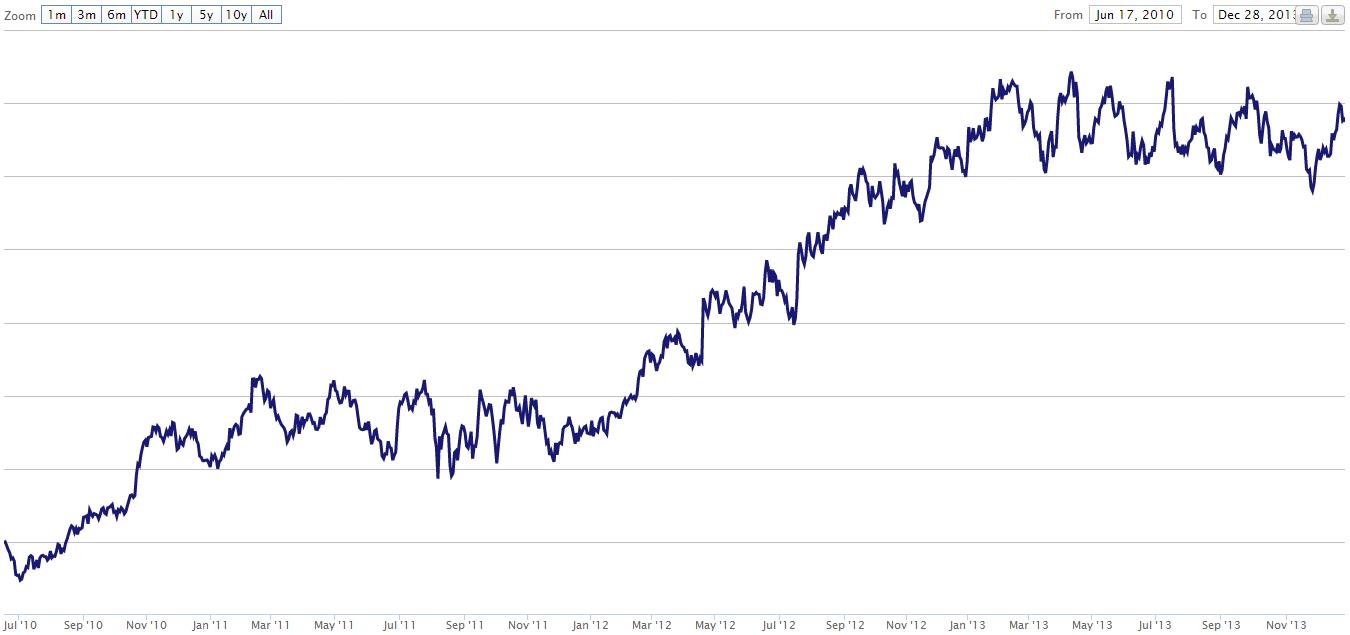
EBAY stock price
It is apparent that the stock has been basically moving sideways for about the last year. It can also be seen that a similar trend occurred in 2011. These trends can easily be highlighted into channels or flags as is shown in the following image.
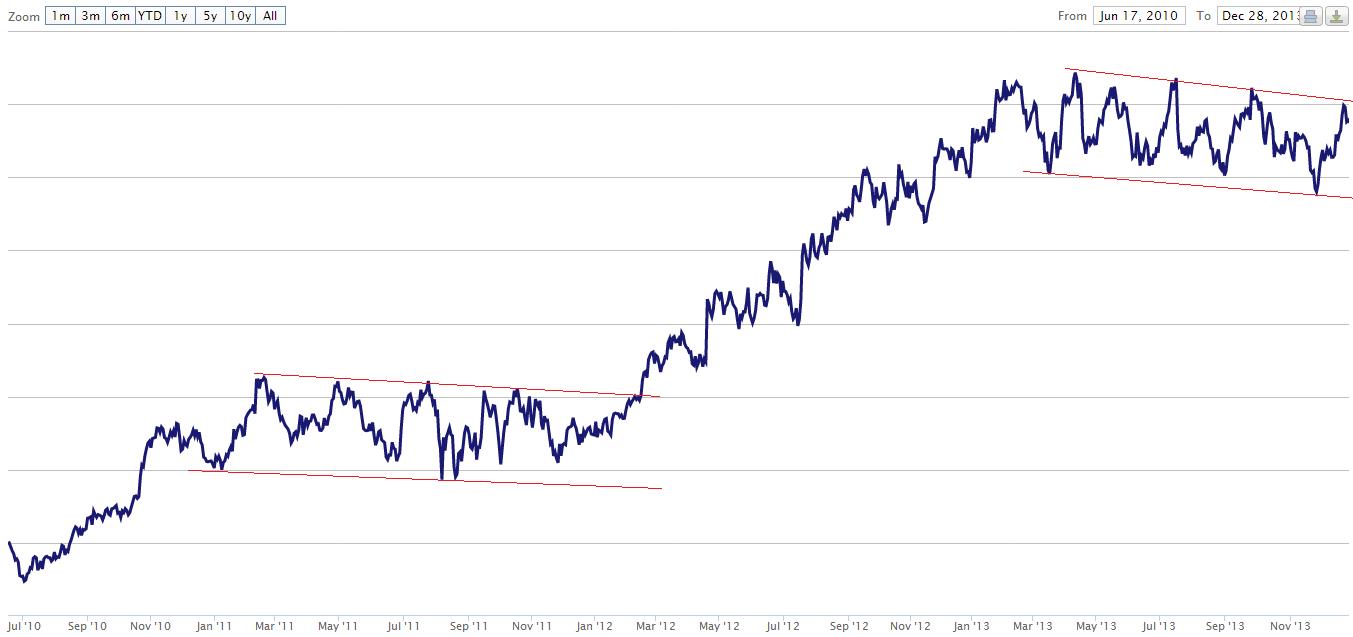
EBAY stock channel consolidations
Channels, similar to the ones in the previous image, occur fairly regularly and are a well-known phenomenon. Trend followers especially like such formations as moving out of a channel in either direction normally signifies a rapid movement. A breakout is referred to as moving upwards past the upper portion of the channel and a breakdown refers to falling below the lower portion. The problem is that it is difficult to know if it will break to the upside or downside, or when such a break will occur.
It looked like the timing for a breakout or breakdown became clearer in late January as the company released its quarterly earnings and Carl Icahn began to push for the company to sell its Paypal unit. Predictably, this generated a considerable amount of attention and mentions, as seen in the following image.
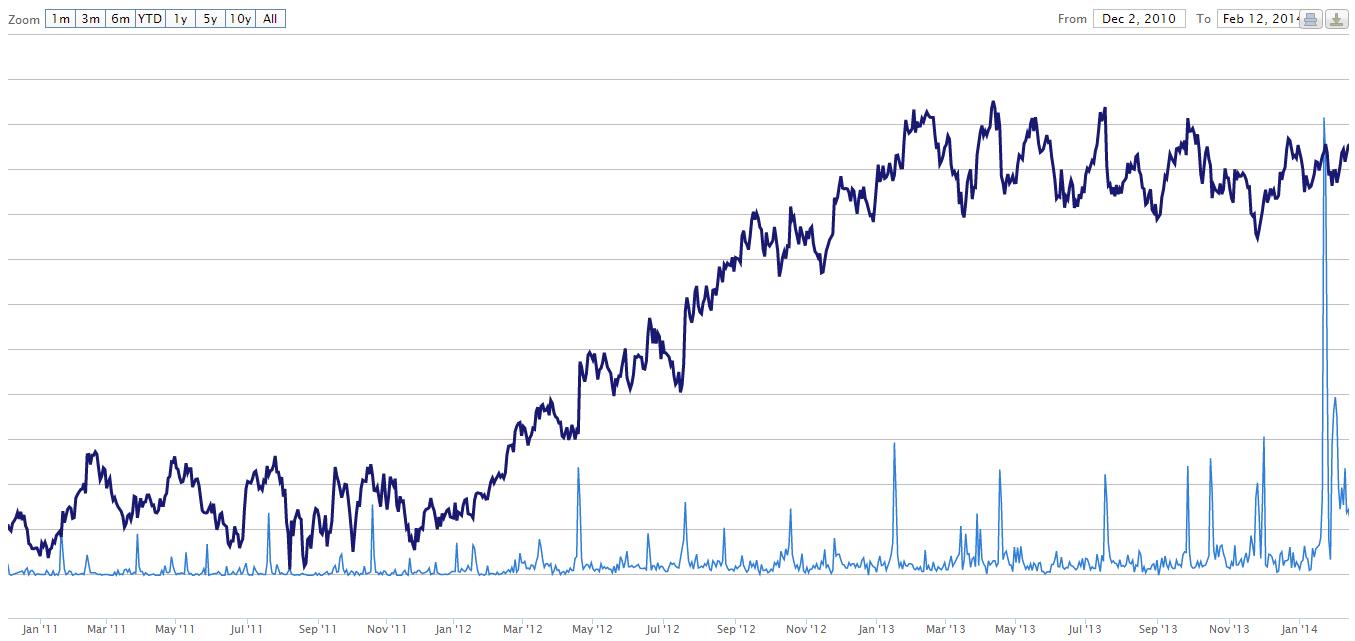
EBAY stock price vs mention volume
The spike in mention volume dwarfed what had come before it. This was a seismic event according to the attention it received. Because the stock price was fairly close to the upper portion of the range, you would expect a breakout if the interpretation was solidly positive. The aggregate sentiment was negative on the day – and it soon fell rather sharply. Judging from the fact that it had failed to breakout on such sizeable news, a trader would likely expect the stock to move to its lower portion of the channel and test that level.
The implied negative sentiment is confirmed by the spike in short selling volume that occurred on the same day, as is seen in the following image.
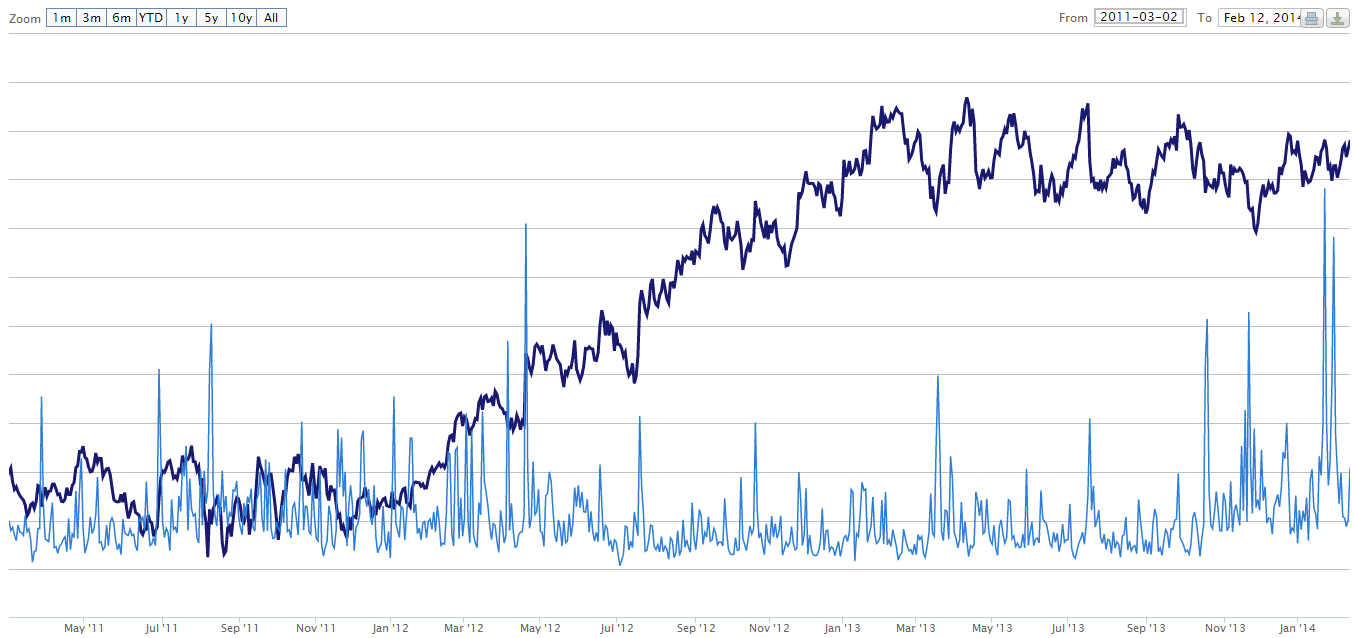
EBAY short selling volume
The corresponding spike in short selling volume was the highest for EBAY during the sample period. It confirmed the general negative interpretation.
Although the stock price declined for the following few days, its decline was in fact rather muted considering the measurement of mentions and short selling. When the stock began to appreciate after a moderate decline, this was a signal that perhaps after going sideways for about a year, all of the potentially bad contingencies had been incorporated.
The next major move for the stock was in fact a breakout (to the upside), which can be seen here.
EBAY stock channel breakout
This breakout was forceful with the stock moving quickly beyond a trading range that had plagued it since the beginning of 2013. It occurring within a few weeks of record-breaking highs in mention volume, in total negative sentiment, and in short-selling volume is a testament to the importance of following multiple variables to understand the situation and stage of a stock and not to simply focus on one variable.
Summarizing:
1. The stock declining from January 23 to January 29 gave sellers ample opportunity to benefit from leveraging the negative NLP polarity sentiment produced by the after-hours January 22 announcements. So, multi-day sentiment traders actually could have profited in this window.
2. There was no further follow through, even with the weight of the short selling behind it.
3. The fact that the stock began to appreciate towards the upper limit of the channel again, so soon after the spikes in mentions, negative total sentiment and short selling should have been a major flag for investors. In other words, if a bearish burst of activity was not enough to send the stock significantly lower the danger of an unexpected upside movement was fairly high.
4. The breakout from a yearlong consolidation soon after these events depicts how markets can actually move in the opposite direction of a shock once they determine that there will be little follow through.