 Click the map to create your own at
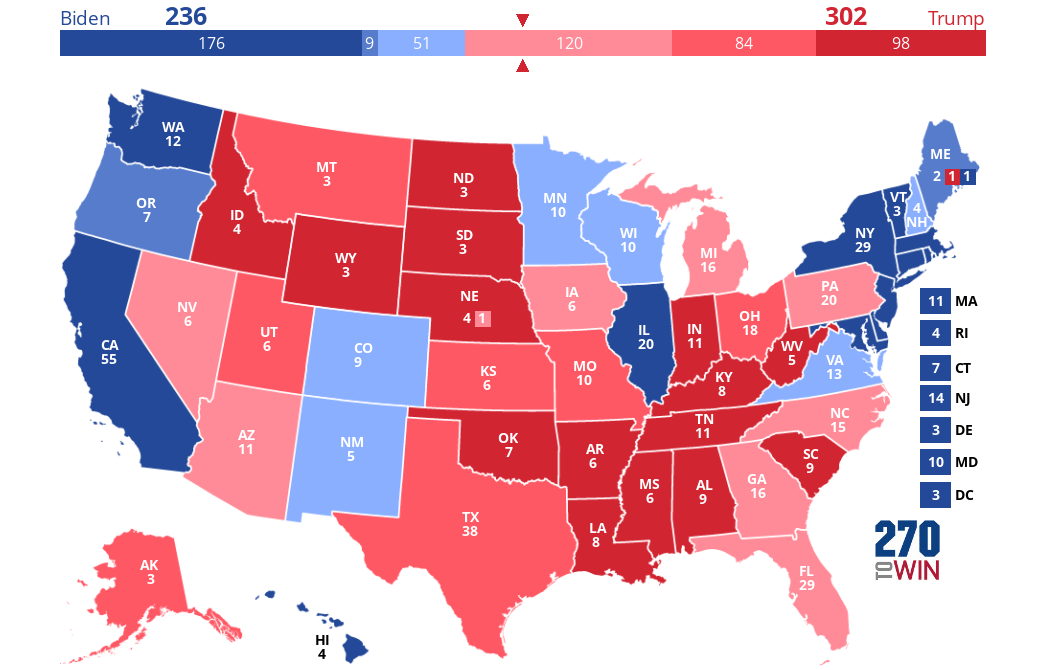
 Trump 302
Biden 236
Our forecast has Trump slightly weaker than in 2016. He drops Wisconsin but picks up Nevada, a smaller state.
Multiple states have teetered, going back and forth during the election cycle. Trump’s late surge which gained momentum around the last debate has pushed some swing states into his column. In a normal election, we would be more confident in our forecast. However, with so many voting early and shifting voting patterns, it is less clear if this late surge will produce the same impact.
Our forecast is admittedly out-of-consensus. The average forecast from traditional model-based forecasters is that Biden will win with 350 electoral votes. A Trump victory, let alone one where he receives 302 electoral votes, is nowhere near consensus.
Alternative data simply show a different state of reality. Whereas polls imply the US shifting to the left of the political spectrum, alternative data show a rightward shift. There are many potential explanations to this divergence, but the fact remains that polls / traditional models and alternative data depict two distinct realities.
We believe that one method will end up being generally correct. Either polls are correct and there will be a landslide Biden victory with a high likelihood of a Trifecta or alternative data are correct and Trump will be re-elected. But, with so many radical changes to the political environment as well as to voting patterns, almost any outcome is conceivable – which is one important reason the public should be warry of the ~ 90% probabilities that other forecasters calculate of a Biden win.
In other areas though, the gulf between these methods was not so wide. Many observations picked up by polls and traditional analysis were also observed in alternative data trends. For instance, increased interest in Trump by African Americans and Hispanics was clear using both as was Trump (unexpectedly) struggling in certain states such as Iowa and North Carolina. Both likewise identified Pennsylvania as perhaps the key battleground state. Trump supporters were also identified as being more enthusiastic by both. All of these points are important to highlight given the somewhat dramatic difference in data sources and approach.
There are perhaps 11 states which could, in theory, vote in either direction. Having an honest, private conversation with most forecasters would likely reveal the same observation. These states include FL, AZ, NV, NC, PA, MI, NH, WI, MN, IA, and OH.
ZettaCap forecasts Trump winning 8/11 whereas most traditional models have Biden winning 10/11.
In many of these states, margins of victory are razor thin. So, a slight shift in general support could entirely flip the electoral map.
As previously stated, Trump has received a surge of support in the alternative data universe over the past week. We believe this to be a strong indication of voting intentions of those voting in-person.
Our data identified a similar late surge in 2016. Our forecast for that election was that Trump would win Michigan, Pennsylvania, and Ohio – a seemingly impossible outcome given the then-current polls. Much of our 2016 general election forecast was based on Trump winning those states.
Will history repeat itself? Will this late surge for Trump portend him winning in states where polls give him little to no chance? Or, will the surge be too little too late? Will such a late surge be proven to be a false positive in an election where so many have already voted?