Forecasting: Bitcoin’s Bubble
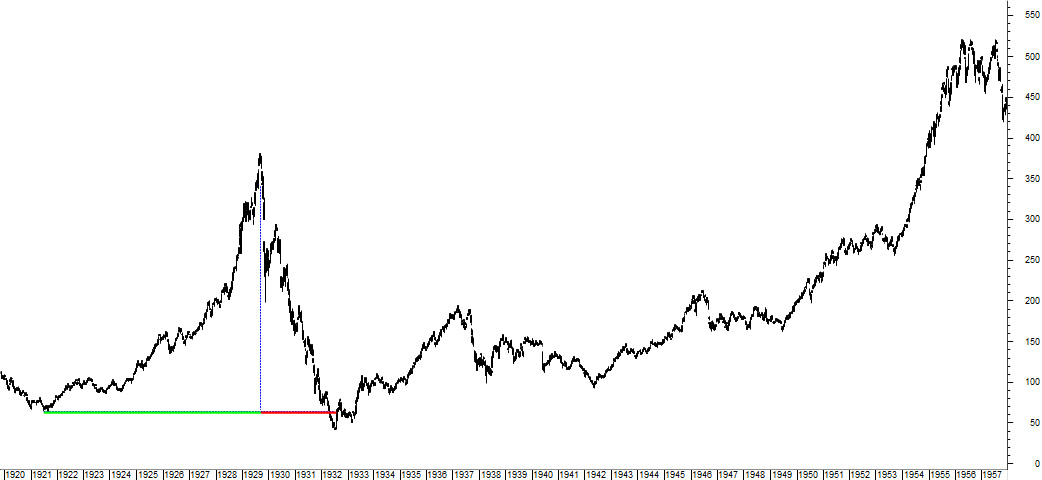
Dow Jones Industrail Average, 1919 to 1957, green line highlights bubble’s appreciation stage while the red line highlights the bubble’s depreciation stage, the remainder of the chart shows the asset’s return to its previous bubble high decades later Source: Federal Reserve Bank and ZettaCap
By year-end 2017, bitcoin (BTC) and other crypto-assets had been appreciating for years. In fact, they were going up much faster than even the most bullish stocks. Further, many observers claimed we were just at the beginning of a global trend wherein nominal state-sponsored currencies were going to be replaced by crypto-assets of one form or another. Their increasing prices seemed to only reinforce the concept that whatever was going on – it was huge.
There were a few lone voices that warned against a potential bubble. The problem was that many, or likely most, of them had been voicing such concerns over a period of years. You would have heard the same commentators state that BTC was in bubble … it will never rise above 100 … it will never go above 1,000 … it will never break 10,000. And then, in December of 2017, when BTC was closing in on 20,000 the same commentators were again calling it a bubble, that it had no value, and that it would go to zero. Such ‘permo-bear’ (permanently bearish) commentators create great soundbites, but due to their one-sided non-negotiable opinion will make the same comments regardless of other conditions.
ZettaCap, in contrast, took its first negative position on BTC in February 2018. It was a precarious time in the market. BTC had made a dramatic peak in December 2017 while other smaller crypto-assets or alt-coins had made new all-time highs in January 2018. The news was filled with an apparent binary choice; the sky’s-the-limit bulls who saw crypto displacing fiat currencies and the permo-bears who saw zero value in the asset class (‘it’s just a Ponzi scheme’). In this environment, ZettaCap came out with a 33-page report, Bitcoin Bubble Bursts, Historical Investment Bubbles Provide Roadmap.
The report postulated that BTC was in a bubble that had already peaked. It also stated that financial bubbles were actually normal in the development of important innovations. Further, the report went on to speculate that BTC had economic value and that historically an investment into post-bubble assets had produced phenomenal returns.
From the report:
The historical investment bubbles used as case studies include the Crash of 1929 (DJIA), Japan’s Bubble (N225), Silver’s Boom and Bust (Silver), Russia’s Bubble (RTSI), Dot-Com Crash (Nasdaq), and US Housing Bubble (REITs and Home Builders). Using a variety of methods, this report analyzes the patterns found in these historical bubbles and applies these findings to forecasting likely scenarios for BTC.
The most likely scenario highlighted in the report was that BTC would deflate over a period of years while falling by over 90%. Bubbles are tricky things to forecast, actually any market movement is inherently difficult to forecast, so please contact an investment professional before taking any action or making any investment decisions. The crypto-asset market has remained weak during 2018 with prices declining considerably from their highs, justifying the early 2018 call.
Important because:
- ZettaCap proved to be one of the only to make an initial bear call for BTC and crypto-assets so close to the actual bubble high,
- ZettaCap did not act like a permo-bear, blarring negative opinions from the sidelines independent of conditions and then trying to declare victory when the asset eventually depreciated,
- In contrast to other bearish calls, ZettaCap sees value in BTC and other crypto-assets, value which will only be recognized by the market once the bubble’s deflation period has ended,
- In contrast to most others, ZettaCap highlights the fact that historical bubble assets usually resemble more of a roller coaster than a single camel’s bump, meaning bubble assets often retest bubble-peaks but do so years, sometimes decades, after the initial bubble.