Stock Price Extraction: Apple (AAPL)
Apple is a bellwether stock and has considerable tweet volume allowing for interesting single stock analysis. Stock sentiment tools have been applied to AAPL and to other stocks but the results tend to be choppy short-term trade signals. Stock Price Extraction (SPE) in contrast shows that implied sentiment can be used for more nuanced medium-term analysis.
SPE identifies stock prices within communications, in this case tweets from StockTwits, and then compares those prices to then-current prices. For instance, assume AAPL is trading at 100 and a trader in a tweet mentions that he believes AAPL is going to 110 – the trader infers a 10% upside for the stock. The algorithm averages these percentage differences throughout a time period, such as a day, in order to determine a SPE sentiment score for that period. The result is a sentiment time series that can be compared to the actual stock price, or in a different situation an asset price like a currency or commodity. The norm is for the SPE sentiment indicator to trend higher during periods of appreciation and lower during periods of depreciation. In a way, it tends to confirm the impact of emotion and greed/fear on what others see as a pure analytical pricing mechanism or as a random walk. Importantly, however, SPE sentiment does not always move in unison with stock price trends but often offers divergent signals around key turning points.
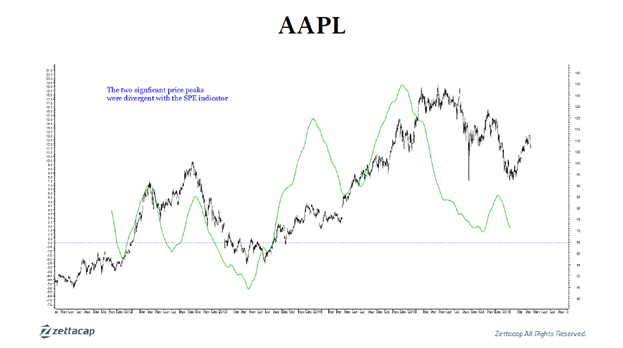
In the chart, we see AAPL stock price versus its SPE sentiment indicator. The horizontal dotted line shows a zero line for sentiment where commentary is equally bullish and bearish as related to the then-current price. Interestingly, the first major price peak was not confirmed by the SPE in that the price made a marginal new high whereas the SPE made a lower high. This divergence is a common warning signal in technical analysis and AAPL clearly provided it. Not only would an attentive trader been able to identify a non-confirmed high using SPE, but would have been able to ride the multi-month depreciation trend once it started as SPE collapsed, even entering negative territory.
The second major stock price high also depicts a significant divergence with SPE. In fact, the divergence is exceptional in that it provided approximately 5 months of warning. While the stock price more or less consolidated around new all-time highs, the SPE moved lower. The eventual sharp decline in the stock price at the end of this sideways price consolidation would not have been such a surprise to a trader following Apple’s SPE sentiment indicator. Such a trader would have seen the implied bullishness of commentators deteriorate over a period of months, such that little in terms of support remained.
Important because:
- Stock Price Extraction sentiment (SPE) works well on bellwether stocks,
- In contrast to other tweet-derived sentiment indicators, it can be used for longer term (multi-month) analysis providing a sentiment indicator more appropriate for those having holding periods of more than a few days,
- SPE shows it is capable to marking important inflexion points through its divergence with stock price trends,