Stock Price Extraction: Crude Oil
Two of the largest complaints against social media based alternative data analysis for investment decision making include limited usage for only certain assets and the signals being too short-term in nature. In this example, we show how Stock Price Extraction (SPE) can be used for Crude Oil, the traded commodity, and for medium-term holding periods.
Sentiment scoring is known to be very volatile. As traditional sentiment scoring is basically based on word analysis, you tend to get explosive positive or negative ratings around certain events (like a report, a quarterly conference call, a news item). Such reactions are often short-lived and the sentiment score will tend to return to more normal levels – in other words trends tend to be quick and explosive.
In contrast, SPE focuses not on words but on prices mentioned about a particular asset. This type of sentiment data is smoother in nature than word-based sentiment which appears more knee-jerk oriented. Commentators, when supplying an actual asset price within the communication (tweet), incorporate past and potential future events into the price mentioned. Commentators that do not mention a price more often comment on hyper-present market conditions or on the latest item impacting the asset. Naturally, tweets mentioning prices are less volatile as they infer value and not just an immediate reaction to an event.
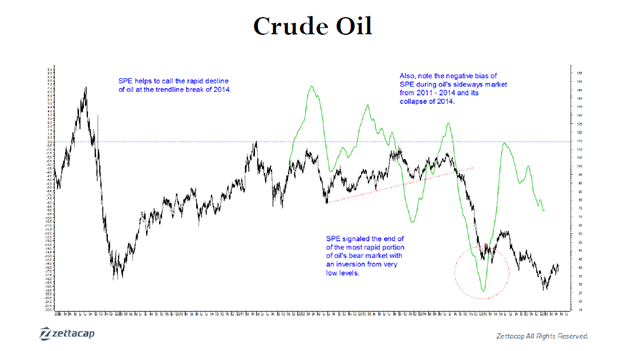
Crude Oil moved sideways before falling quickly into a bear market. SPE helped in identifying the important tops and bottoms during the sideways trend. Then, combining the trends of SPE with simple trendlines on the actual price chart, we can see that it helped to identify the collapse of the oil price as SPE continued to decline even as many technical traders might have thought prices to be oversold.
At the panic low of oil prices, SPE again came in handy. SPE bottomed before oil prices hit their lows, offering traders a conditional buy signal – a multi-month price rally ensued shortly thereafter. Oil prices made important lows before moving significantly higher (not shown in chart) which were not confirmed by SPE which ended up showing divergence.
Important because:
- SPE works with commodities,
- SPE, a sentiment indicator, tends to work well for multi-month holding periods,
- SPE can be combined with other technical indicators such as trend lines to improve analysis,